
Writing code is easy. Handling messy code in other people’s libraries, investigating unreproduced scenarios in strict production environments, now that will 100% guarantee you gray hairs and a long-lasting burnout. Not unless you equip yourself with ninja-level debugging skills that I’m about to show you.
The blog delves into various reverse engineering and debugging techniques using DotPeek, DnSpy, Fiddler, as well as Application Insights which are super useful for any C# or .Net developer stuck in a writer’s debugger’s block.
1. Configure Application Insights
Application Insights is an instrumentation tool that will help you monitor every kind of metric you can ever think of. It is well integrated with Azure as well as many modern .Net web applications.

With application insights you can:
- Monitor incoming and outgoing requests using Live Metrics
- Configure your application to send telemetry data
- You can then analyze your application traffic for/to:
- Users, sessions, and events – You can also create your own custom events in your app to for example monitors certain clicks or user behavior
- Understand your user behavior using Funnels
- Check if your application load times are affecting users using Impact
- Segment your users using Cohorts
- Analyze Retention
- Analyze how users navigate through your application using User Flows
Configuring Application Insights In .Net Core Web Application
We won’t go into the details of telemetry using application insights but I just want to show you how easy it is to configure it for the entire application or in code:
Application Wide Auto-Instrumentation
You can configure application insights on your web application and automatically collect telemetry data. This is done like this:

- Right-click on your solution node
- Click on Configure Application Insights
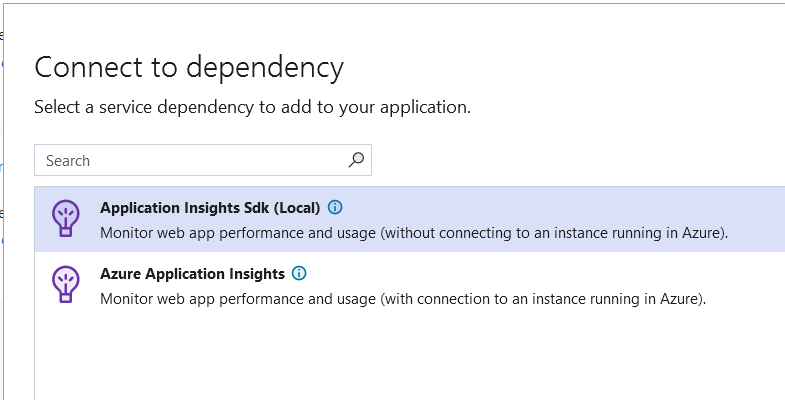
You have the option to configure application insights locally or connect to an instance created on Azure. Let’s choose local for now and click next and finish on the rest of the screens.

Now, if you run the application, you can click on the application insights icon on top. And a window of all the events monitored will be displayed.

Now try to refresh the pages in your web application or browse different pages, you will notice in that the search bar icon is updated and new events are traced.
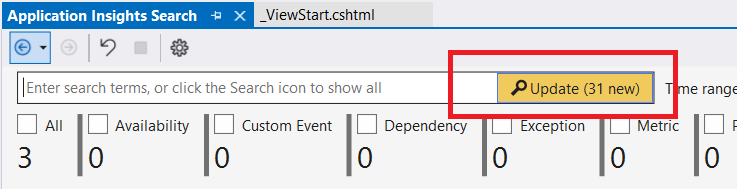
- Update the timestamps to include the period that you were testing the app
- Make sure to check all the events
- Click search, you will find all your requests and metrics displayed in the bar chart as well as in the detailed window below it

Code Implementation
In addition to application-wide auto-instrumentation, you have the option to trace custom events in your application. A brief overview of this can be done using a simple console app here.
You need to import the application insights SDK and make use of the TelemetryClient class and call the TrackEvent function, similar to this:
TelemetryClient client = new TelemetryClient();
client.TrackEvent("MyCustomEvent");
You can find more on that on the Application Insights official Microsoft documentation or you can check section 11 Instrument Solutions to Support Monitoring and Logging of my AZ 204 Course where I dive into the details of configuring instrumentation for application
Constraints
You can monitor your app using application insights in visual studio, but in order to reap the benefits of application insights, you need to host it on Azure. And this might pose a constraint if you’re deploying your app on-premises or in a closed environment. In this case, you will need to install an instrumentation agent on your on-premise server similar to this.
But we’re just adding complexity here and would rather recommend using application insights if you’re planning to host your application on Azure.
2. Implement a Logging Middleware Using ASP.NET Core Filters
Another best practice for preparing your application for errors is implementing a request middleware. Net Core makes it super easy to add middlewares to your application using something called✨filters✨.

Filters are a great way to implement logging and exception handling at an application scope level, this will prevent duplicate logging codes scattered in try catch blocks.
You can always use dependency injection, singleton logger class, log4net and what nots to log errors, however the beauty of filters is that you only write code in one place and you only have to add the middleware to your application settings.
Filters allow you to run code operations before or after an HTTP request and implement operations like:
- Exception Handling
- Security Policies
- Redirection
- Caching
The different types of filters .Net have to offer are:
In our case, implementing an exception filter makes perfect sense and you can then log all the application exceptions in one place. A code example for a .Net 6 web API can be like this:
program.cs
builder.Services.AddControllers(options => {
    options.Filters.Add<ExceptionHandler>();
});
ExceptionHandler.cs
  public class ExceptionHandler : IExceptionFilter
    {
        private readonly IHostEnvironment _hostEnvironment;

        public ExceptionHandler(IHostEnvironment hostEnvironment) =>
            _hostEnvironment = hostEnvironment;

        public void OnException(ExceptionContext context)
        {
            // Log your exception somewhere
            // ......

            // Return the exception result to the content of the current request
            context.Result = new ContentResult
            {
                Content = context.Exception.ToString()
            };

        }
    }
You can learn more about filters in .Net Core 6 here https://learn.microsoft.com/en-usf/aspnet/core/mvc/controllers/filters?view=aspnetcore-6.0
3. Use DotPeek to Decompile DLLs and Read Source Code
Dotpeek is a free .Net decompiler and assembly explorer, you can use it to decompile and read source code.

It can decompile any .net assembly and display the source code in multiple formats like .dll, .exe, and .winmd. This can be extremely useful in case you want to understand frameworks that you’re using or you want to reproduce an issue.
Example in the image below, we can browse through the different Serialization/Deserialization methods of the Newtonsoft librairy:

You will just need to load the assembly or .dll file in the explorer window and browse through the different methods. DotPeek will automatically reverse engineer the methods and classes and show you approximately how the code looks.
You can download and start using DotPeek here for free. Try it out It’s an amazing tool.
4. Generate PDB Files Using DotPeek as a Symbol Server
Other than using Dotpeek as a assembly decompiler, you can use it use as a symbol server in visual studio as well as generate debug symbol files or .pdb files for mysterious trouble causing DLLs.

This can be extremely useful if you want to debug compiled code that you don’t have the pdb symbols for.
What’s a PDB file/symbol?
Generated after a build, PDB files simply contain information about the code compiled in its assembly form. Usually .pdb files and .dll (assembly) files have the same name. When an exception is thrown and logged, PDB files help provide the line the error was thrown as well as other necessary debugging information.
How To Configure DotPeek Symbol Server In Visual Studio
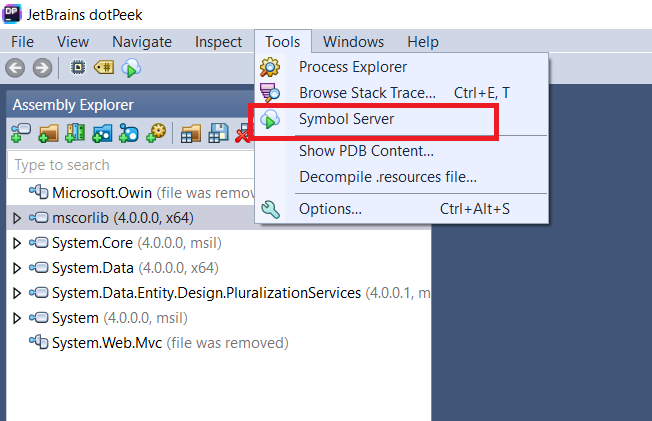
After you’ve installed Dotpeek, you need to go to Tools > Symbol Server
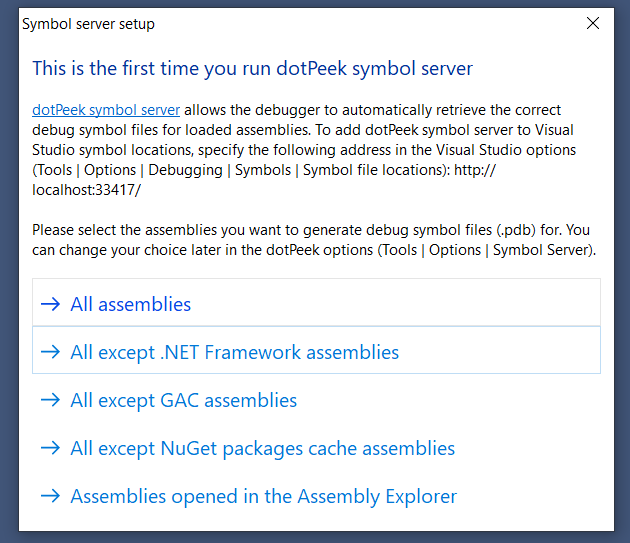
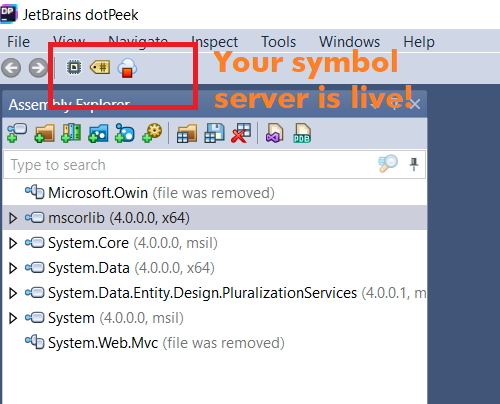
You need to choose which assemblies you want to generate debug symbols for. I tend to go for the last option and generate symbol files for the assemblies that I currently opened in DotPeek.
You will notice in DotPeek IDE that your symbol server is live by the cloud icon.
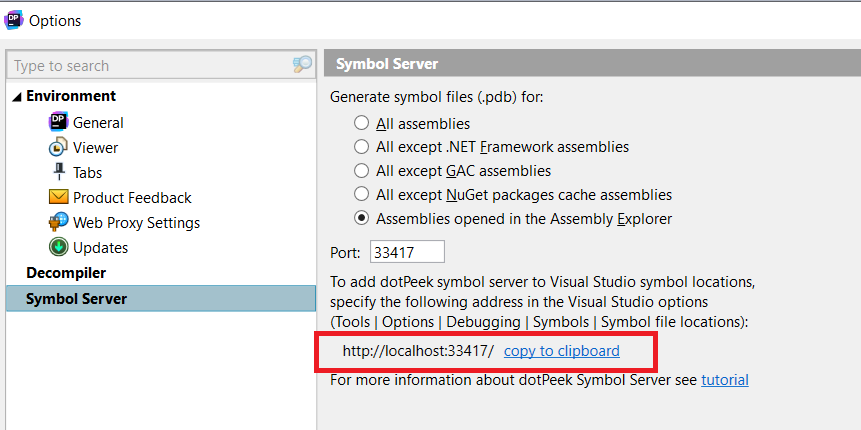
Copy the symbol server url by going to Tools > Options > Symbol Server, press on copy to clipboard.
Then go to visual studio, Tools > Options > Debugging > Symbols, Click on the add/plus button and paste the symbol server url.

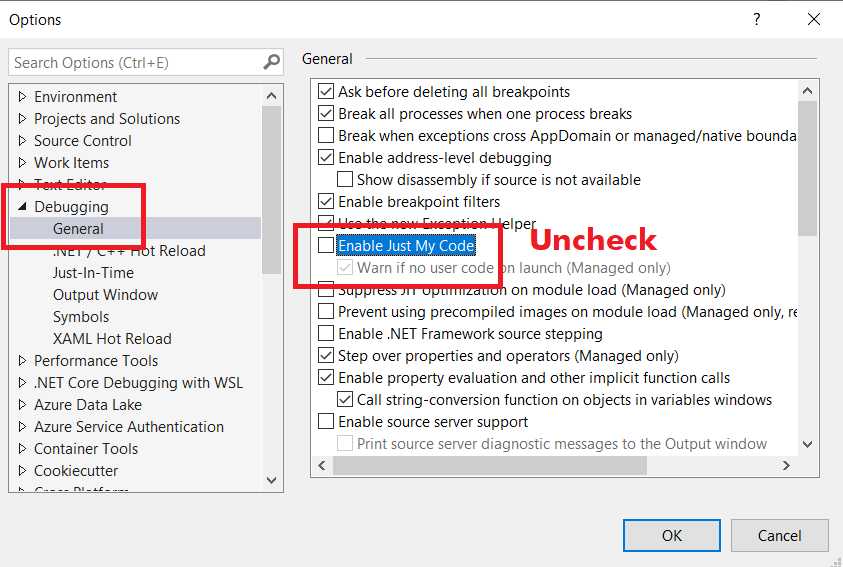
Then go to Debugging > General, and disable Just My Code,
And that’s it, the next time you run your application, the symbols will be loaded from DotPeek and you will be able to debug the referenced assemblies.
5. Use DnSpy as a Debugging Tool
DnSpy is a debugger and .Net assembly editor. You can edit and debug assemblies, even without source code.

DnSpy can decompile and display the source code of any .dll or .exe file. You can place breakpoints in the decompiled code and debug it. An example below using DNSpy to debug the built-in StringBuilder class:

This comes in handy when the environment that you’re debugging on:
- Does not allow visual studio installation
- You cannot use remote debuggers
- You’re short on time
- You need a super quick way to understand the problem
In that case, DNSpy might help you figure out the issue but I otherwise don’t recommend this approach unless you absolutely have to..
You can download the tool and try it from here: https://github.com/dnSpy/dnSpy/releases
6. Use Fiddler to Monitor Requests
Fiddler is a debugging proxy tool that can intercept network traffic and provide request details for both incoming and outgoing. You can even modify the header or body of the request and replay it!
You can see in the below Fiddler IDE screenshot that I’m currently editing this blog on WordPress on “public-api.wordpress.com”. The top window has all the request details, the bottom window has all the response details.

For editing a request:
- Right-click on any request
- Click on Unlock for Editing
- From the top middle window, click on Headers, and modify them
For replaying a request:
- Right-click on any request
- Click on the Replay content menu
- You will have several options to replay the request
Debugging Encrypted Traffic
In order to debug encrypted traffic (https), you will need to enable the “Decrypt HTTPS traffic” option and install and trust Fiddler’s certificate on your machine. Vickie Li explains it better in her medium blog here.
Using Fiddler In Your Debugging Journey
Let’s talk about how you can use fiddler to your advantage. Fiddler can be super helpful in the below scenarios:
- You have a legacy web application with no proper logging, you can use Fiddler to diagnose requests that are throwing errors
- You can reproduce tricky bug scenarios by using Fiddler’s replay feature
- You can quickly monitor performance issues by identifying long running requests
You can download Fiddler for free here.
7. Isolate the Problem, Write a Console App
K.I.S.S. : Keep it simple, stupid
-Some Anonymous Wise Human-

I lost count of the times I was digging through log files or searching in the wrong places while diagnosing an issue.
Always target the core of the issue, and in case you are managing libraries you can use Dotpeek to extract the source code that you are calling and write a console app using that code.
As last resort, you can always make use of the mighty console app to:
- Debug a block of source code of a framework after you reverse-engineered it using Dotpeek
- Diagnose performance issues: run a piece of code that you suspect has performance bottlenecks
- Ping Endpoints: use PowerShell, cmd, or console app to check if an endpoint is alive
Final Thoughts
Application Insights is a great overall telemetry utility you can easily integrate with any modern web application. DotPeek and DnSpy are some incredible reverse engineering tools to debug c#.net or other .net frameworks even in the most complicated scenario you can imagine. Fiddler is a great network interceptor tool that will help you modify or replay HTTP requests and finally console apps help you isolate the problem by running nasty troublemaking code chunks.